If you are new to climate information, we recommend that you read the Introduction to climate information before using the Data Access Platform.
Select an indicator
Use the menus under the headings Indicator, Model and Past & Future to make a detailed indicator selection.

Indicator Menu
For each indicator type there are a number of indicators. Most indicators can be shown as both annual and monthly (January, February etc.) 30 year averages.

Start by unfolding the Indicator type and select – this will automatically generate the indicators available for that type in the drop-down list of Indicator. Corresponding temporal aggregations available will be find in the drop-down list under 30-yr averages.
When a new indicator type is selected the indicators are automatically changed to the indicators related to that type. A notification of this change is shown in the top right corner.
Need guidance?
Model Menu
Select the model of interest in the Model ensemble drop-down list. The Data Access Platform contains indicators based on both global (CMIP5 and CMIP6) models and regional (CORDEX) models. Some indicators are provided both with and without bias-adjustment. This is selected in the Bias adjusted drop-down list. By choosing in the drop-down list of Ensemble member, it is possible to view each ensemble member or the median of the full ensemble (default).

Need guidance?
Past & Future Menu
Select between several time-periods: the past, near future, mid-century or end-century. The past is considered as the reference period with results given as absolute values, while the future is given as percentage change compared to this reference.
The emission scenarios (RCP or SSP) available in the emission scenario drop-down list depends on the selected model ensemble, which use different emission scenarios.

Need guidance?
Notifications
Automatic selections are made in some situations. For example, when a new indicator type is selected the indicator is automatically changed to an indicator of that type. A notification of this change is shown in the top right corner. Another example could be if the selected emission scenario is not available when changing the model ensemble. The emission scenario is then changed to an available scenario and a notification is displayed. A summary of the selected indicator is shown below the map.

Map presentation
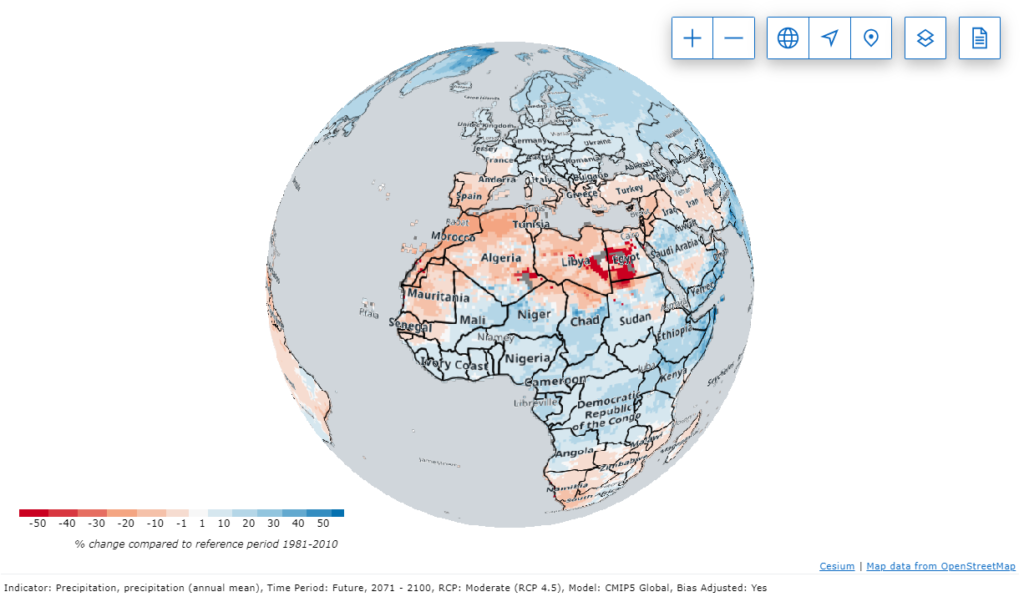
The map show the selected indicator and a map legend explains the colors in the map.

A map menu is found at the top of the map. With this menu it is possible to zoom in and out on the map, change the presentation between a globe and a flat map, search for a location, change the map layers that are visible and to read metadata.


Graph
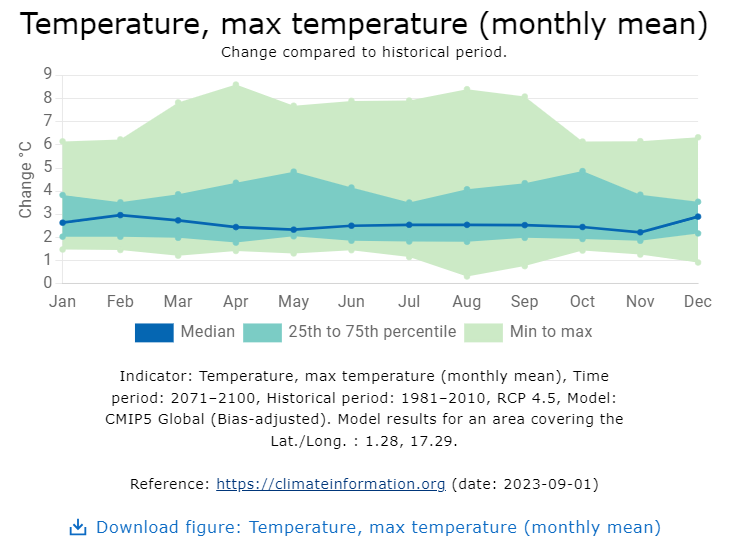
Different types of graphs are shown depending on the indicator selected in the indicator menu. It is possible to download the figure by clicking this option under the graph caption text. The downloaded figure contains a reference to the website.


Table
The information shown in the graphs are also presented in a table when clicking the table tab.

Download
It is possible to download an indicator in Excel or NetCDF format. Download can be done for the selected area of interest or a larger area (square).


