A starting point is the future emissions scenarios. What would you like to explore? Business-as-usual or a moderate path with reduced emissions? Scenarios for the evolution of greenhouse gas emissions are provided by Representative Concentration Pathways (RCPs) or Shared Socioeconomic Pathways (SSPs), as prepared for the IPCC-assessments.
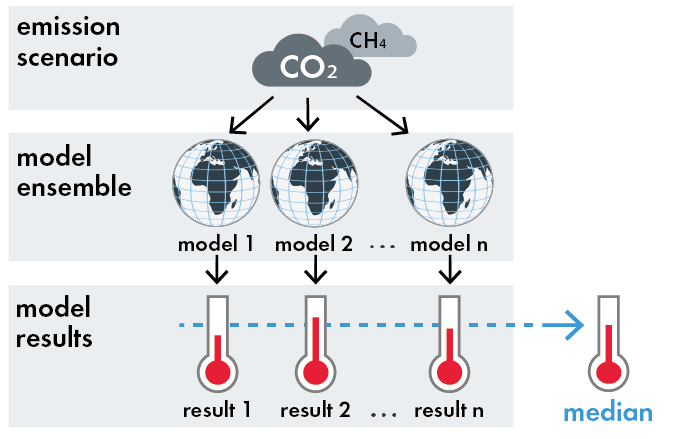
The level of future emissions is described with emissions scenarios.
Global Climate Models (GCMs) are then applied to study how these emissions affect the climate. The various GCMs differ in how they simulate processes of the Earth’s climate, and thus also in their sensitivity to the greenhouse gas forcing, i.e. how the GCM’s climate respond to changes in emissions. Each GCM has its own strengths and weaknesses.
Future climate change cannot be supported by evidence from a future that does not exist yet, therefore the evidence in support of a hypothesis about the future comes in the form of model projections. In climate science, projections are regarded as well-supported if a sufficiently diverse set of models agrees on the results. Ensemble statistics, e.g. the average or median result from of a number of models, are therefore considered more reliable and robust than using a single model projection.
The median result from an ensemble of models, when exploring the effect of an emission scenario.
GCMs have a typical horizontal resolution of several hundred kilometers, and since climate impact processes occur at much smaller scales, a further downscaling of the GCM information is useful. This is performed by Regional Climate Models (RCMs), which nest into the GCM and provide finer scale information of 50 km or less. CMIP(Coupled Model Intercomparison Project) and CORDEX(Coordinated Regional climate Downscaling EXperiment) are two global collaboration programs under WCRP(the World Climate Research Program) of WMO (World Meteorological Organization) that coordinate GCM and RCM ensembles respectively.
Downscaling of a global climate model to a regional climate model.
Hydrological and other impact modelling applications are sensitive to climate model bias. Bias is a systematic deviation from observed statistics, e.g. consistently too wet or too warm climate in a certain region of the world. It is common practice to apply bias adjustment, a statistical method that removes various errors from the climate model output so that the model data become more similar to observed data (locally gridded or point data from gauges).
Bias adjustment so that climate model output become more similar to observations . The bias adjustment identifies a statistical connection between values in the model to values of similar frequency in the observed climate. A transfer function is then mapping the model values (horizontal arrow) to remove systematic deviations (bias).
Climate indicators of weather and water variables are produced at the end of the computation chain, to show how the climate changes between different time periods and for a given emission scenario. Since climate is an average of the weather over a long period of time, indicators are often produced as an average over thirty years.
In the Climate Information Portal, three future time periods are used to compare the future climate projections to the historical reference period 1981-2010 to get a measure of climate change.
Each model step in the production chain includes uncertainties, with the main uncertainty within each emission scenario arising from difference between the climate models. Therefore, an ensemble of projections (multiple RCMs and/or GCMs) is used to account for the spread of possible climate impacts in the future. The uncertainties inform about the reliability of the climate projection. A result is more robust when many models agree on the sign and the magnitude of climate change. The exact future still remains unknown but the model results indicates tendencies and future risks generated by climate change.
Agreement on sign of change compared to the reference period is a measure of how robust the result is.
This website uses cookies to improve your experience. By browsing our site we'll assume you're ok with this!OK
Privacy & Cookies Policy
Privacy Overview
This website uses cookies to improve your experience while you navigate through the website. Out of these, the cookies that are categorized as necessary are stored on your browser as they are essential for the working of basic functionalities of the website. We also use third-party cookies that help us analyze and understand how you use this website. These cookies will be stored in your browser only with your consent. You also have the option to opt-out of these cookies. But opting out of some of these cookies may affect your browsing experience.
Necessary cookies are absolutely essential for the website to function properly. This category only includes cookies that ensures basic functionalities and security features of the website. These cookies do not store any personal information.
Any cookies that may not be particularly necessary for the website to function and is used specifically to collect user personal data via analytics, ads, other embedded contents are termed as non-necessary cookies. It is mandatory to procure user consent prior to running these cookies on your website.