Which climate information and Which tool should I use?
Which tool should I use?
Which tool to use depends primarily on:
the purpose (which type of output you need),
if you already have access to data (temperature and precipitation data for a point or a grid),
your background in climate science.
A summary is provded below to guide you to the right tool. You can also find the tool difficulty level (basic, intermediate and advanced) next to each tool. This rating is based on tool complexity and the level of climate science knowledge needed to understand the information.
No. All indicators are pre-calculated based on climate models (calculated from two well trusted and globally known climate scientific communities: CMIP5 and CORDEX). Read more: Production of Climate Indicators.
Settings needed to use the tool?
You only need to select a location, a future emission scenario and a future time period. Everything else is pre-selected to provide the best available data for the selected location.
Tool output?
A climate overview for a specific site.
Possible to sort indicators by magnitude of change and robustness.
Maps, graphs and summary texts ready for climate communication (downloadable in PNG-files)
Both climate and water indicators for three future time periods (presented as change compared to a historical period).
Quality checked data from CMIP and CORDEX climate modelling communities.
No. All indicators are pre-calculated based on climate models (calculated from two well trusted and globally known climate scientific communities: CMIP5 and CORDEX). Read more: Production of Climate Indicators.
Settings needed to use the tool?
You can make detailed selections to analyse all the data available at climateinformation.org
Facts sheets from the Knowledge basesupport the user with definitions and explanations of basic climate science.
Tool output?
Interactive maps and graphs for further analysis.
Possible to download PNG-files of graphs.
Possible to download data in NetCDF or excel-format for further analysis and local tailoring.
Both climate and water indicators for the past (presented in absolute values) and the future (presented as change compared to a historical period).
Quality checked data from CMIP and CORDEX climate modelling communities.
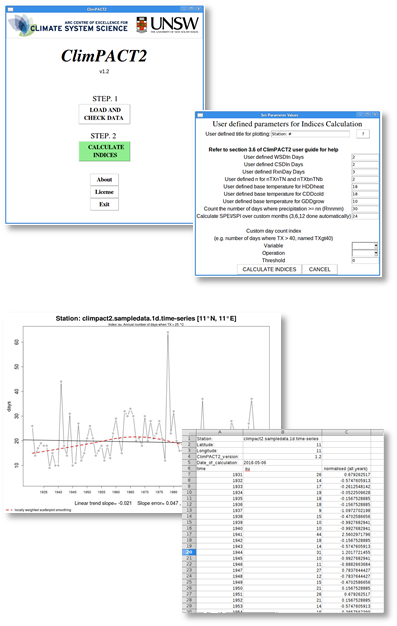
Yes. Requires that you insert data yourself (temperature and precipitation data for a point or a grid) for past, present or future climate.
Settings needed to use the tool?
Climpact and R package can be installed on your computer (Windows or Linux) to produce outputs. A web-based version is also available.
You can make detailed settings for indicator calculations.
Previous knowledge in climate science is recommended for correct use and interpretation.
Tool output?
Graph plots and csv-files with climate indicators (statistical analysis) for your own point or grid.
Climate indicators (not water) for the past, present and future. To produce future indicators you need to have modelled input data.
Quality checked by the user of the tool. The quality of the output indicators depends on the quality of the input data. Some quality control functionality is available in the tool.
We propose to use Climate Indicators, which is an aggregate measure of climate change on complex environmental phenomena in terms of trends and variability. The indicators we provide are commonly used and can be applied for impact analysis in many societal sectors. The same water indicators can for example be used for several assessments, such as potential for hydropower in the energy sector, navigation in the transport sector, city planning in the infrastructure sector, availability of fresh water in the health sector, risks for flooding in the buildings sector, etc.
This website uses cookies to improve your experience. By browsing our site we'll assume you're ok with this!OK
Privacy & Cookies Policy
Privacy Overview
This website uses cookies to improve your experience while you navigate through the website. Out of these, the cookies that are categorized as necessary are stored on your browser as they are essential for the working of basic functionalities of the website. We also use third-party cookies that help us analyze and understand how you use this website. These cookies will be stored in your browser only with your consent. You also have the option to opt-out of these cookies. But opting out of some of these cookies may affect your browsing experience.
Necessary cookies are absolutely essential for the website to function properly. This category only includes cookies that ensures basic functionalities and security features of the website. These cookies do not store any personal information.
Any cookies that may not be particularly necessary for the website to function and is used specifically to collect user personal data via analytics, ads, other embedded contents are termed as non-necessary cookies. It is mandatory to procure user consent prior to running these cookies on your website.