Climpact
Calculate climate indicators using your own weather and climate data
Climpact is a software package to calculate climate indicators that are relevant for health, agriculture, water and other socio-economic sectors.
Climate indicators calculated by Climpact are adequate to document climate variability and change in the ‘Climate-science basis’ of a project proposal intended to be submitted to the Green Climate Fund.
The indicators calculated by Climpact are derived from daily temperature and rainfall data.
Preferably, such daily data should be from instrumental observations, as long and complete as possible. However, in some regions of the world, instrumental records are not as long and complete as they ideally should be. So, Climpact can allow the calculation of indicators from alternate data sources (for example from remote sensing data like satellite observations or reanalysis).
Climpact allows you to calculate these indicators from your own daily weather data—either plain-text point data (from a weather station, for example) or across an entire gridded NetCDF file (like climate model output).

Climpact was originally developed by the World Meteorological Organization’s Expert Team on Sector-Specific Climate Indices (ET-SCI) to help researchers deliver useful and relevant climate information to sector users. It has also been supported by funding from the Australian Research Council Centre of Excellence for Climate Extremes and the Green Climate Fund.
Ready to get started with Climpact? Find out how you can install the latest version of the R package, Climpact2, including video tutorials and how you can get started producing output here. This information is also available in the user guide.
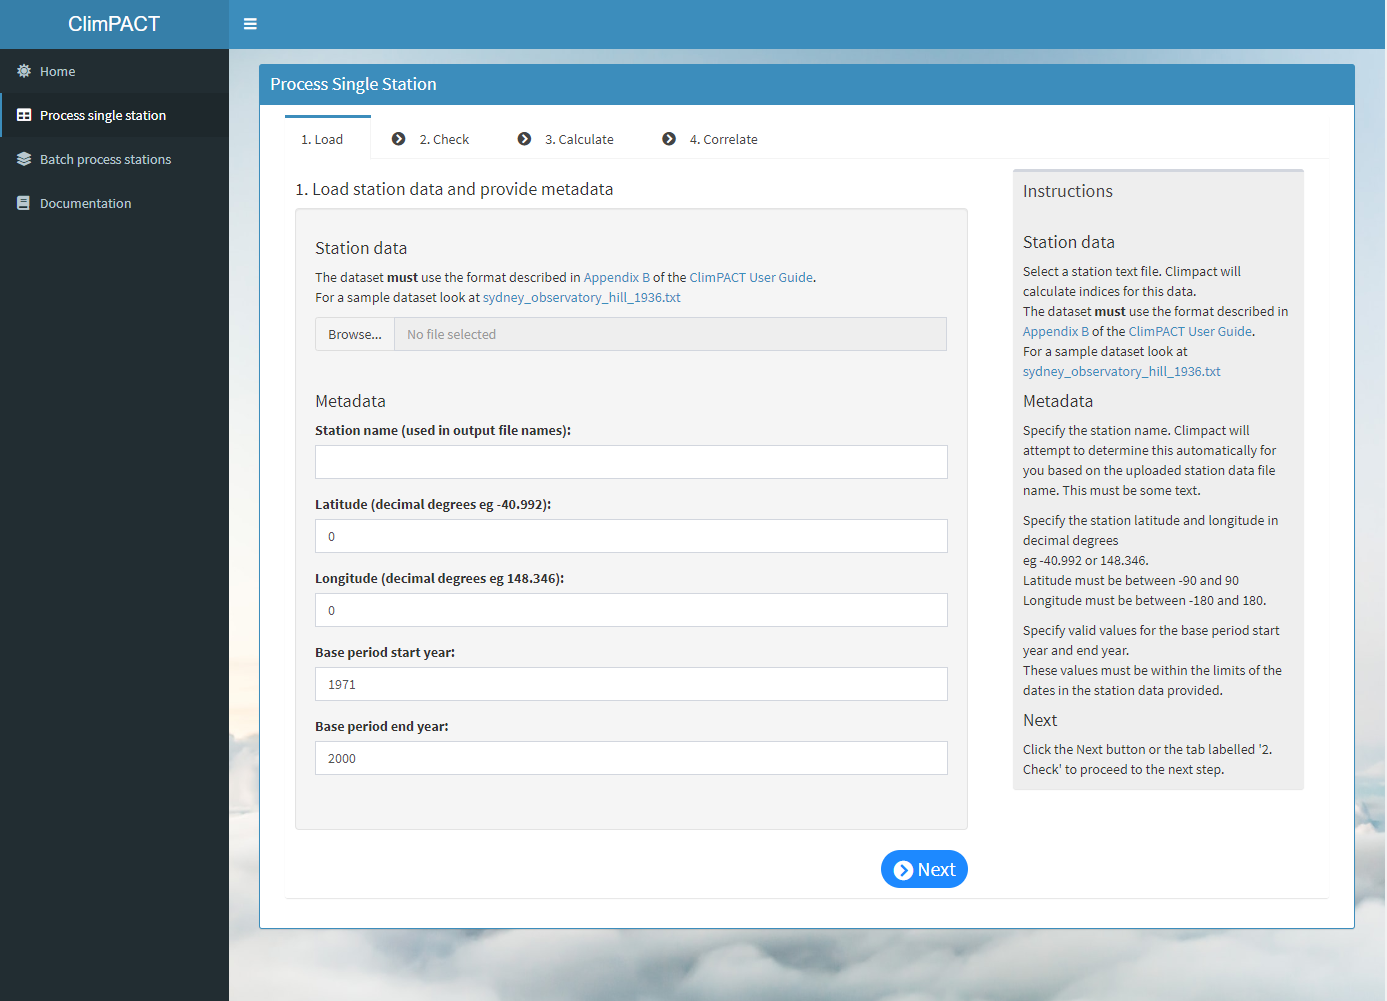
A web-based version of Climpact (Climpact3) has recently been developed that allows users to calculate indicators without installing any software.

Climpact Website
Download the Climpact tool for local use.

Web-based Climpact
Calculate indicators using a web-based tool.
Note: By clicking these you will leave this site.

